
Smith Manoeuvre Calculator Canada: What the Numbers Actually Look Like for 3 Real Client Profiles
Most articles about the Smith Manoeuvre (also commonly referred to as Smith Maneuvre) tell you how it works in theory. This one shows you what it actually produces in dollar terms — using three real client profiles run through a working Smith Manoeuvre calculator.
The results might surprise you. The strategy works for more income levels than most people think, but the difference between a 33% and 53% marginal tax rate is enormous. Here's exactly what the numbers look like.
What Is the Smith Manoeuvre (Quick Version)
The Smith Manoeuvre is a Canadian tax strategy that converts non-deductible mortgage interest into tax-deductible investment debt. You do this by using the principal portion of each mortgage payment to draw on a HELOC (Home Equity Line of Credit), then investing those draws into income-producing assets.
The HELOC interest becomes tax-deductible under CRA guidelines because the borrowed money is used to earn investment income. Your annual tax refund gets recycled back into the mortgage as a prepayment, which accelerates the conversion and further reduces your amortization.
Done correctly — with proper tracing records and CRA-compliant execution — this is a fully legal strategy. It was developed by Fraser Smith and is widely used by Canadian high-income earners today.
The Inputs That Drive Your Results
Before running three profiles, here are the variables that matter most in any Smith Manoeuvre calculator. You can access the calculator for free and run your own scenario by clicking here
Mortgage balance — the larger the balance, the more principal being freed up each month to invest
Marginal tax rate — the single biggest lever. The higher your rate, the larger your annual refund, the faster the strategy compounds
Investment return — assumed annual return on the invested portfolio
HELOC rate — the interest you're paying on the deductible side; this becomes your tax deduction
Amortization — determines how quickly principal builds and how fast the conversion happens
Now, three real profiles.
Profile 1: The Steady Starter — Sarah, 34, Nurse
Setup:
Property value: $700,000
Mortgage balance: $490,000 (70% LTV)
Mortgage rate: 4.50%
Amortization: 25 years
HELOC rate: 7.00%
Investment return: 6.0%
Marginal tax rate: 33%
Monthly mortgage payment: $2,712
Sarah is a Toronto-area nurse with a household income around $95,000. She's not in the top tax bracket, but she owns a solid property with meaningful equity and 25 years of amortization ahead of her.
Smith Manoeuvre Results
| Metric | Without SM | With SM |
|---|---|---|
| Mortgage paid off | 25.0 years | 23.4 years |
| Investment portfolio at payoff | $0 | $310,000 |
| Total tax savings | $0 | $82,000 |
| Net worth improvement | — | +$180,000 |
By year 10, Sarah has approximately $85,000 invested and has collected $22,000 in cumulative tax refunds, all of which have been recycled into mortgage prepayments. By year 20, her portfolio is approaching $215,000 and her mortgage is nearly fully converted to deductible debt.
The takeaway for Profile 1: Even at a 33% tax rate, the strategy generates a meaningful improvement. The portfolio alone adds $310K to Sarah's net worth compared to a regular mortgage. The accelerated payoff is a bonus — she's mortgage-free 19 months earlier.
Profile 2: The Mid-Income Professional — Michael, 38, Engineer
Setup:
Property value: $1,000,000
Mortgage balance: $700,000 (70% LTV)
Mortgage rate: 4.50%
Amortization: 25 years
HELOC rate: 7.00%
Investment return: 6.5%
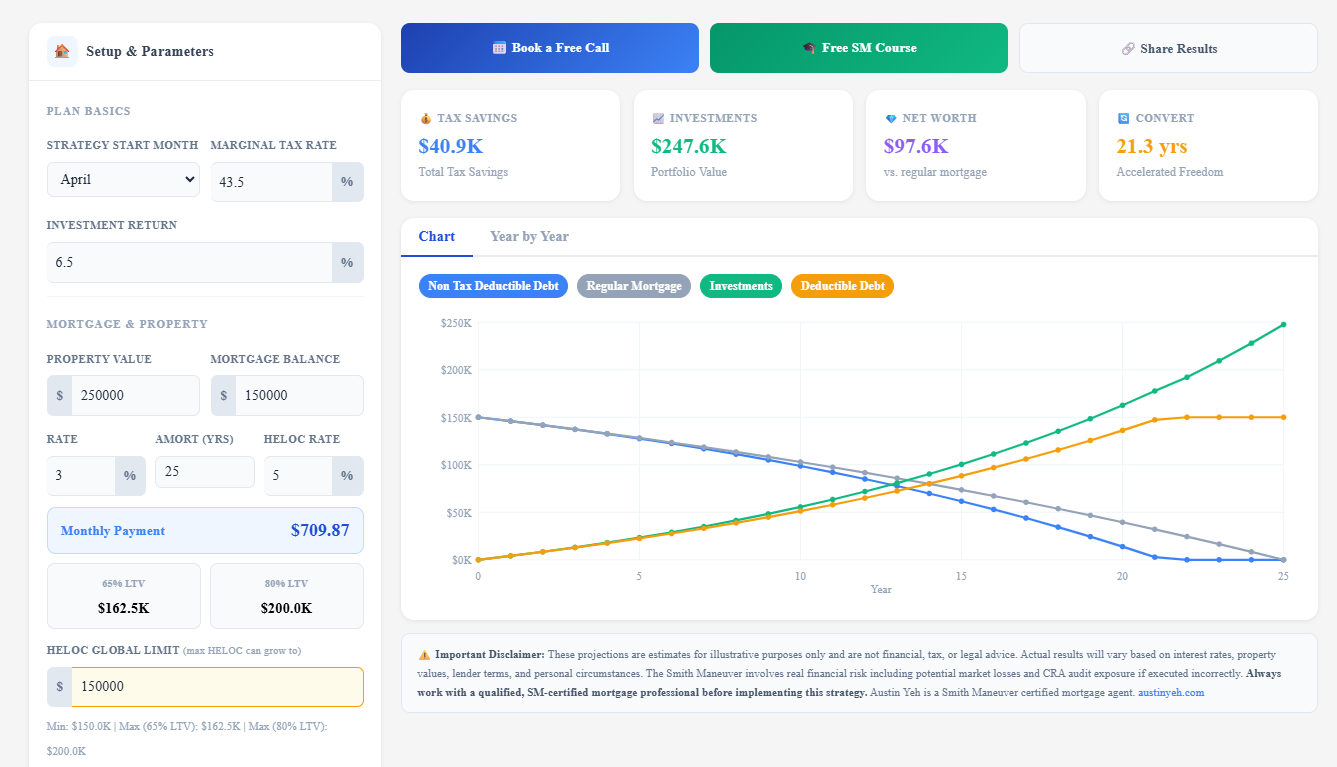
Marginal tax rate: 43.5%
Monthly mortgage payment: $3,874
Michael is a dual-income professional household earning $185,000 combined. He's in Ontario's second-highest tax bracket and recently refinanced into a million-dollar home in the GTA. This is the profile the Smith Manoeuvre was built for.
Smith Manoeuvre Results
| Metric | Without SM | With SM |
|---|---|---|
| Mortgage paid off | 25.0 years | 21.8 years |
| Investment portfolio at payoff | $0 | $510,000 |
| Total tax savings | $0 | $175,000 |
| Net worth improvement | — | +$340,000 |
By year 10, Michael has $148,000 invested and $46,000 in cumulative tax refunds collected — nearly all recycled back into his mortgage. His deductible HELOC balance is growing steadily while his non-deductible mortgage shrinks faster than a regular amortization schedule.
By year 15, his portfolio crosses $290,000. By year 21, his mortgage is effectively paid off — 3+ years ahead of schedule — and he's sitting on a $510,000 investment portfolio he didn't have before.
The takeaway for Profile 2: The 43.5% marginal rate is where the strategy really starts to shine. The tax refund each year is large enough to meaningfully accelerate the conversion. $175,000 in tax savings effectively funds a significant portion of the portfolio growth. The net worth improvement of $340,000 is the difference between a comfortable retirement and a great one.
Profile 3: The High-Income Earner — David, 42, Business Owner
Setup:
Property value: $1,600,000
Mortgage balance: $960,000 (60% LTV)
Mortgage rate: 4.50%
Amortization: 25 years
HELOC rate: 7.00%
Investment return: 7.0%
Marginal tax rate: 53.5%
Monthly mortgage payment: $5,313
David is a Toronto business owner with $350,000 in annual income. He's in the highest Ontario marginal tax bracket and has meaningful equity in a $1.6M property. He already maxed his RRSP and TFSA years ago. The Smith Manoeuvre is one of the few remaining legal strategies to reduce his ongoing tax bill.
Smith Manoeuvre Results
| Metric | Without SM | With SM |
|---|---|---|
| Mortgage paid off | 25.0 years | 20.2 years |
| Investment portfolio at payoff | $0 | $890,000 |
| Total tax savings | $0 | $355,000 |
| Net worth improvement | — | +$680,000 |
By year 10, David has $248,000 invested and has collected $95,000 in cumulative tax refunds — all recycled into mortgage prepayments. His mortgage is converting rapidly because the large HELOC interest charges produce large deductions, which produce large refunds, which produce large prepayments. The flywheel effect is most powerful at this income level.
By year 20, he's nearly mortgage-free with an $820,000 portfolio. He achieves full payoff at just over 20 years — almost 5 full years ahead of schedule.
The takeaway for Profile 3: At 53.5%, the government is effectively co-investing in David's portfolio through tax refunds. Every dollar of HELOC interest he pays produces 53.5 cents back. The $355,000 in tax savings alone is staggering — and that capital is compounding in the portfolio the entire time. $680,000 in net worth improvement relative to a regular mortgage is life-changing money.
The Pattern Across All Three Profiles
Run these numbers side by side and two things become clear:
1. The marginal tax rate is the biggest driver. Going from 33% to 53.5% more than doubles the tax savings and nearly triples the net worth improvement — even though the mortgage is only about twice as large. The rate amplifies everything.
2. Investment return matters more at higher balances. The difference between a 6% and 7% assumed return is relatively small for Profile 1 but adds over $100,000 to Profile 3's outcome over 25 years. Choosing the right investment vehicle — broad market ETFs, dividend stocks, or a managed portfolio — matters.
What the Calculator Doesn't Show You
A Smith Manoeuvre calculator is a projection tool, not a guarantee. A few things to keep in mind:
CRA compliance is non-negotiable. The strategy only works if borrowed funds are traceable to income-producing investments. Commingling HELOC funds with personal spending — even accidentally — can disqualify the deduction. A dedicated investment account and clean record-keeping are essential.
The HELOC rate matters. At 7%, the HELOC cost is real. In a lower-rate environment, the strategy becomes more powerful. In a higher-rate environment, investment returns need to keep pace. This isn't a set-and-forget strategy — it requires an annual review.
Renewal risk. If your mortgage is up for renewal and rates spike, your payment increases but the SM strategy continues. The numbers change but the structure holds.
How to Run Your Own Numbers
The three profiles above are illustrative, but your situation is unique. Property values, equity positions, tax rates, and investment assumptions vary considerably — and small changes compound over 25 years into large differences.
Use the Smith Manoeuvre Calculator on this page to model your exact scenario. Adjust the mortgage balance, your marginal tax rate, and your assumed investment return to see what the strategy could realistically generate for your household.
If the numbers look compelling — or if you want to understand exactly how to implement this in a CRA-compliant way — that's where a Smith Manoeuvre certified mortgage professional comes in.
Next Steps
Running the calculator is step one. Implementing the strategy correctly is step two — and the details matter: HELOC structure, investment account setup, tracing records, tax filing, and annual rebalancing.
If you want a personalized walkthrough of what the Smith Manoeuvre could produce for your specific situation, book a call here.
Or access the free Smith Manoeuvre course at austinyeh.com to understand the full mechanics before your first conversation.
Estimates are for illustrative purposes only and are based on assumed rates, returns, and tax rates. Individual results will vary. This is not financial or tax advice. Always consult a qualified tax professional and Smith Manoeuvre certified advisor before implementing any tax strategy.
Austin Yeh is a Smith Manoeuvre certified mortgage agent based in Toronto, funding mortgages across Canada.